VA Clinical Design System
Overview
In 2024, the fast growth of product teams within the staff-facing clinical decision support space created a need for it’s own design system meant for data dense environments for clinical workflows.
We needed data visualizations, considerations for patient safety, and accessible employee experiences.
Our primary work includes creating foundations, components, and patterns for the Clinical Decision Support software that is EHR (electronic health record) agnostic.
My role
Design system lead – product & design strategy and feedback
Team
Ann L., PM
Annie C., Product designer
Juan P., Product designer
Ben N., UX Researcher
Helene M., Engineer
Sangmee S., Engineer
John H., Engineer
Anish K., Accessibility lead
Liz B., Product design lead
Scope of work
We continue to expand the design system by codifying design decisions to scale efficiency in design and reduce costly custom coding for engineers across many teams.
Recent priorities include adding design patterns for data visualizations, global navigation, task drawer, and patient summary data.
While also building out foundational tokens, documentation, and contributing back our collaborations to the VA design system and the US web design system.
Establishing a design system team
When I joined the existing design system team as the design system lead, it comprised of two mighty team members, an engineer and a designer. They did a tremendous job attempting to support the existing 5 product teams. This was the first design system at the VA that would be prioritizing the needs of staff-facing enterprise software, and this DS is specific for clinicians. We needed more support if we were going to get out of the feature request reactionary ways of working and into a proactive team building complex components. In Fall 2024, we added 6 additional team members.
Addressing pain points to establish solid foundations
After building out the design system team, I identified specific priorities we needed to address as part of a long-term roadmap and increasing design system maturity.
Product inconsistency
Low design system maturity that was missing foundational tokens meant designers and engineers was making their best guesses in UI designs.
Impact → Build out missing foundations
Develop a strategy to import existing foundational tokens and spacing from our parent VA design system and add new as needed to support our data dense interfaces. Typography and spacing tokens are now available.
Misaligned parity
In my initial audit, I observed that Storybook was the source of truth and our main design system site and Figma files were not in parity making it confusing for teams.
Impact → Aim for 1:1:1 parity
Every new addition to the design system will have a quality review check to include Storybook parity with Figma and guidance documentation as part of the definition of done. There is still work to do, audit prior content for parity.
Accessibility issues
Accessibility and responsive designs were overlooked. In reality, usability research consistently showed clinicians were using multiple programs side-by-side and used a narrow browser width.
Impact → Improved Accessibility
Achieve perfect Section 508 federal government accessibility scores and meet WCAG 2.1 AA standards. We also have been paying close attention to touch target spacing throughout all revised components and tokens.
Incomplete guidance documentation
Our main documentation site had outdated and/or missing guidance on how to use the design system and how to use each component.
Impact → Supporting our users
Provide guidance in written form, office hours, and feedback on tickets that our teams add to the contribution backlog. Engage with teams early when building out new components with workshops.
Low adoption
Some teams were using third-party design systems to supplement for needs such as a complex data grid and other teams were beginning to need the same component.
Impact → Increased adoption rates
We set out to measure baseline adoption metrics with a quarterly metrics from there.
Low contributions
The design system did not have a clear and understandable way for teams to contribute their work back to the design system and frankly didn’t see the need.
Impact → Increased contributions
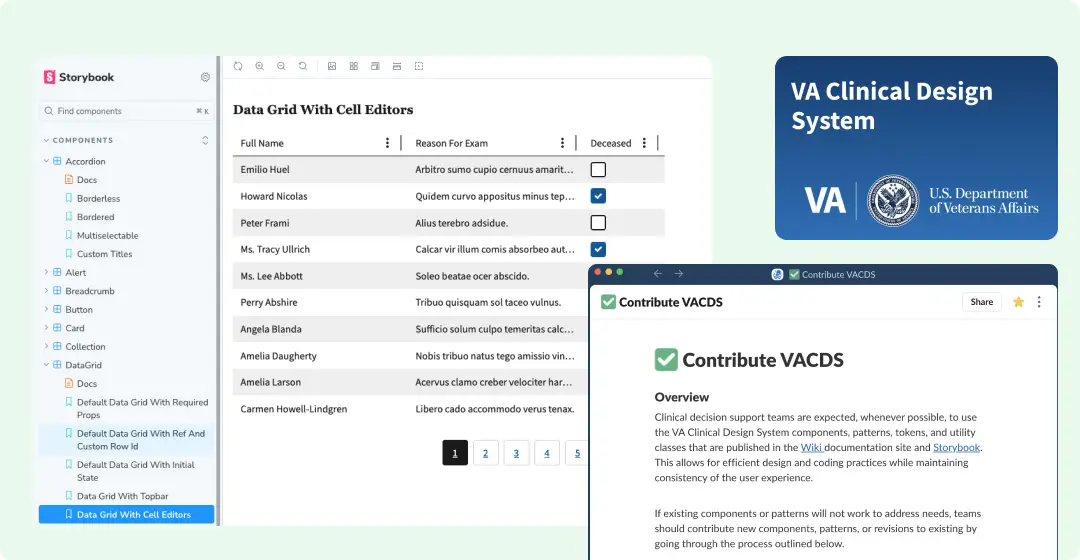
I wrote and published a new contribution model that outlined a step-by-step process for new additions, bugs, and contributing code once approved by our design system engineer.
Prioritized component and patterns to increase design system maturity, meet the needs of our users, and create a consistent application UI.
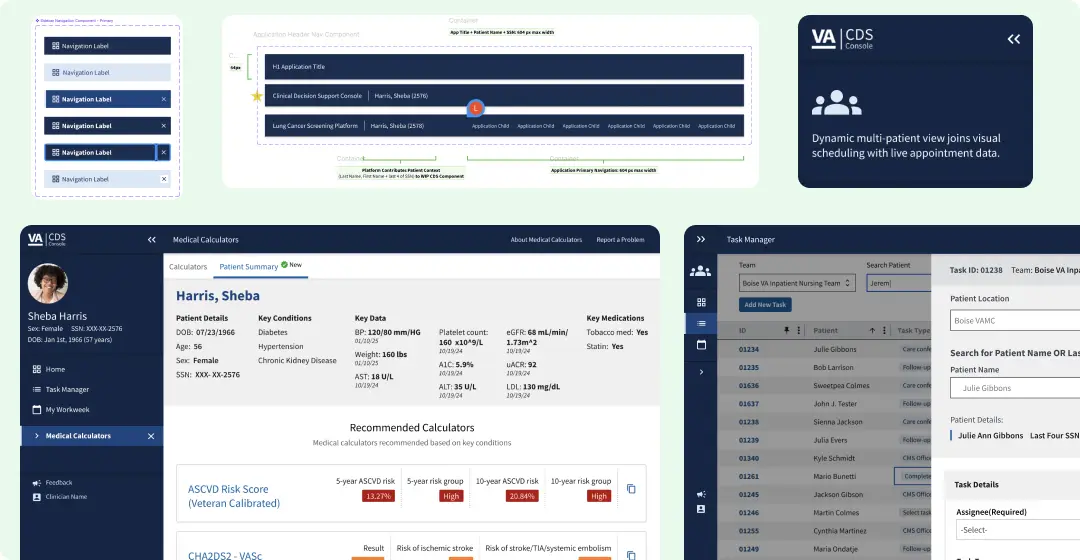
Global navigation
Clinician decision support application sidebar navigation and global header were created to provide users with a consistent and reliable navigation no matter which clinician application or tool they were using so they could navigate quickly between tools during patient interactions while maintaining patient safety. Provided a consistent application UI experience as they navigated between clinical decision support tools prev-visit and during patient visits. Allowing the sidebar to collapse, provided additional space for full application tool in right panel particularly useful in data dense environments.
This work has gone through multiple research studies with clinicians and patient safety experts to ensure we solved for the right problems across clinician roles and specialties.
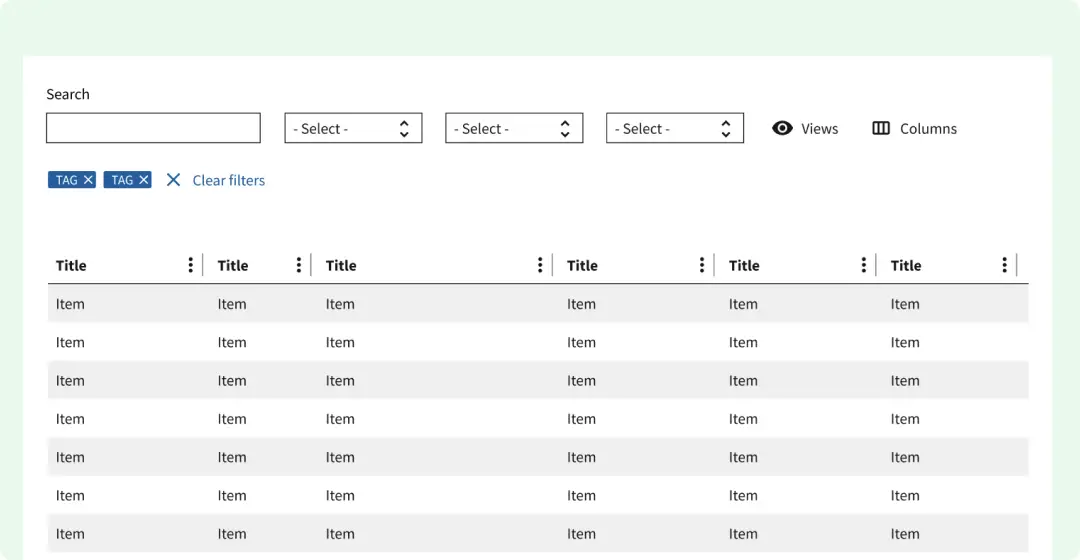
Data Grid
Provides users with an interactive, structured table that allows them to quickly view, edit, filter, sort, edit in line, and manipulate large datasets. Unlike static tables, a data grid provides dynamic functionality such as search, pagination, column customization, and actions to support data analysis and decision-making.
Reflection
While the team has made tremendous progress to date on complex patterns, we have ambitious goals for the next six months including contributing more staff-facing components and patterns to our primary VA design system and the US web design system for more Federal agencies to use, scaling beyond the VA to all Federal government agencies.
In progress components and patterns:
- Data visualization charts for charting data over time such as blood pressure readings and patient generated health data
- Patient summary detail card
- Task drawer
- Clinical decision support application landing page that has interoperability with EHR and shows contextually relevant patient generated health data to call attention to disease process that are out of control and need clinician attention dependent on tech discovery of CDS hooks.